Results
Techno-economic, social and environmental assessment of complete chains
Assessment
For the overall assessment reference cases were defined for each of the energy carrier conversion pathways, which then have been assessed in view to techno-economic, environmental and social aspects. The backbone for the BioBoost assessment methodology relies on the GBEP framework. The Global Bioenergy Partnership (GBEP) developed a set of indicators for policymakers and stakeholders to guide the development of the bioenergy sector and to meet international goals on sustainable development. These sustainability indicators are science-based and refer to environmental, social, and economic aspects. They are based on earlier roadmaps on biofuels by the International Energy Agency (IEA). For the specific techno-economic Key Performance Indicators, guidelines from the European Industrial Bioenergy Initiative were also applied.

Environmental performance of fuels from fast pyrolysis and catalytic pyrolysis pathway

The environmental assessment follows a three step approach. In the first step only the greenhouse gas (GHG) footprint is assessed according to the Renewable Energy Directive (RED) method. In the second step, additional environmental impacts from conventional Life Cycle Assessment are taken into account according to ISO standards 14040 and 14044 (ISO, 2009a, b) and utilizing the ReCiPe methodology. Finally, in the third step “new” bio-related impacts concerning water and soil quality as well as land use are assessed. These effects usually are not yet included in a conventional LCA.
Fuels via gasification of biosyncrude from straw
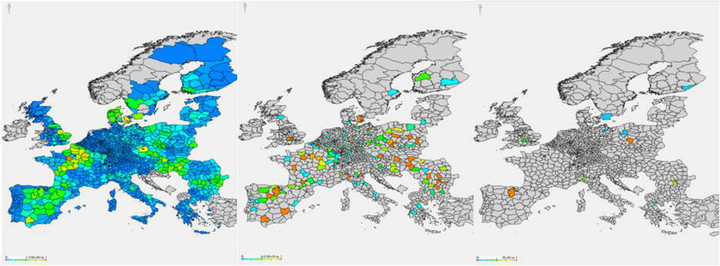
- Straw potential in Europe
- Locations and capacities of local fast pyrolysis plants
- Locations and capacities of central plants in Europe.
Colors indicate volumes or size of the respective parameter: red is high/large, green is medium, blue is small and grey is zero.
 Â
Â
The EU wide simulation of the fast pyrolysis pathway implementation shows a straw utilization of 52 Mio.t/a for biofuel production, meaning an average utilization share per region of 35 %. This results in the production of 5.5 Mio.t of biofuel per year, which is 1.25 % of the current total transportation fuel consumption in Europe. The regions with the highest straw production can be found in France, Spain and in the East of Europe in general.
Fuels via refinery processing of catalytic pyrolysis oil from wood chips

The simulation of the EU wide catalytic pyrolysis pathway implementation showed a forestry residue utilization of 23.2 Mio.t/a for biofuel production, which is equivalent to an average of 20Â % per region. With the current state of the art this would result in the production of 4 Mio.t/a biofuel which is 0.9Â % of the current fuel demand in Europe. The regions with the highest forestry residue production are located in the Scandinavian countries, the East of Europe and France. The optimum scenario utilizes 120 forestry residue converting catalytic pyrolysis plants, of which ca. 60 % have an annual conversion capacity between 200-400 kt.
Fuels via refinery processing of catalytic pyrolysis oil from wood chips
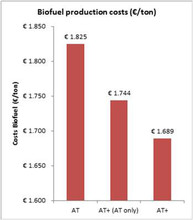
Exemplary, three different regional scenarios were considered for biofuel business cases via the fast pyrolysis and catalytic pyrolysis pathway: (i) an optimization considering only Austria (scenario AU), (ii) Austria as part of a region including its neighboring countries (AU+), and (iii) Austria as part of whole Europe (EU). The impact on the biofuel business case in Austria was assessed. In all scenarios a biofuel selling price of 2.50 EUR/kg was applied.
Not surprisingly, biofuel production is not profitable when its implementation is limited to the borders of Austria. It is possible to convert straw to biofuel by building three fast pyrolysis plants and one central conversion plant, but no profit will be made. This is mainly due to the mismatch between the capacities of local and central plants. When neighboring countries are considered in the simulation, a profit is generated. Import and export of feedstock and intermediate products take place, resulting in the construction of 5 fast pyrolysis plants and one central plant erected in Austria. However, when EU wide implementation is simulated, no central plants are built in Austria. In case of the catalytic pyrolysis pathway, simulation of all implementation constellations resulted in the construction of profitable central conversion plants in Austria. With expansion of the implementation area the overall biofuel production costs are significantly reduced.
Hydrothermal Carbonization - Biocoal to heat and power
The products of the hydrothermal carbonization pathway, electricity and heat, cannot directly be compared with the products from the fast pyrolysis and catalytic pyrolysis pathways for transportation fuel production, which are energy carriers. Heat and power are energy end products.

| Dateityp | Datei | Dateigröße | Download |
|---|---|---|---|
| Del 6.2 Solid energy carrier combustion | 2626 KB | Download | |
| Del 6.4 Energy carrier chain LCA | 6026 KB | Download | |
| Del 6.5 Market implementation plan | 3770 KB | Download |
Achievements
Synthetic biofuel in general not yet competitive with market prices.
Recomendations
Aim at high performance fuel
(components), business models with
blending to premium brands or ful-
illing GHG avoidance requirements.
Legal obligation on GHG avoidance in transport would favour market
introduction. The cost of fuel produced at the first best fuel plants in the EU is competitive to ethanol in the German fuel market.
Achievements
Reduction of CO2 emissions of all pathways > 80%
Meets requirements of EU regulations.
Â
Achievements
Low (conventional) environmental impacts, compared to fossil route, new impacts can result in an increase.
Recomendations
Further development on consideration of new impacts neccessary.
Achievements
Choice of feedstock has large impact on the environmental performance.
Recomendations
Each feedstock requires separate consideration.